
01
Upload
Drop in the CSV from POS, inventory, finance, CRM, marketplace, logistics, or support tools.
I.S.A.A.C turns uploads into readable summaries, adaptive filters, clean charts, editable rows, and an AI assistant that answers questions about the file.
Try it with your CSV - no sign-inCSV to dashboard
Upload sales, stock, finance, support, operations, or any tabular export.
Ask the file
Question the dataset in plain language instead of hunting through columns.
Edit and export
Switch into edit mode only when needed, then export the cleaned CSV.
The product
This is the public product tour, not the private workspace. It shows the moments buyers care about: upload, understand, ask, edit, export, and continue from phone or tablet before they create an account.
100%
Browser-first
No install needed for PC users
Tap
Mobile charts
Inspect values without hover
AI
CSV-aware
Answers tied to uploaded data
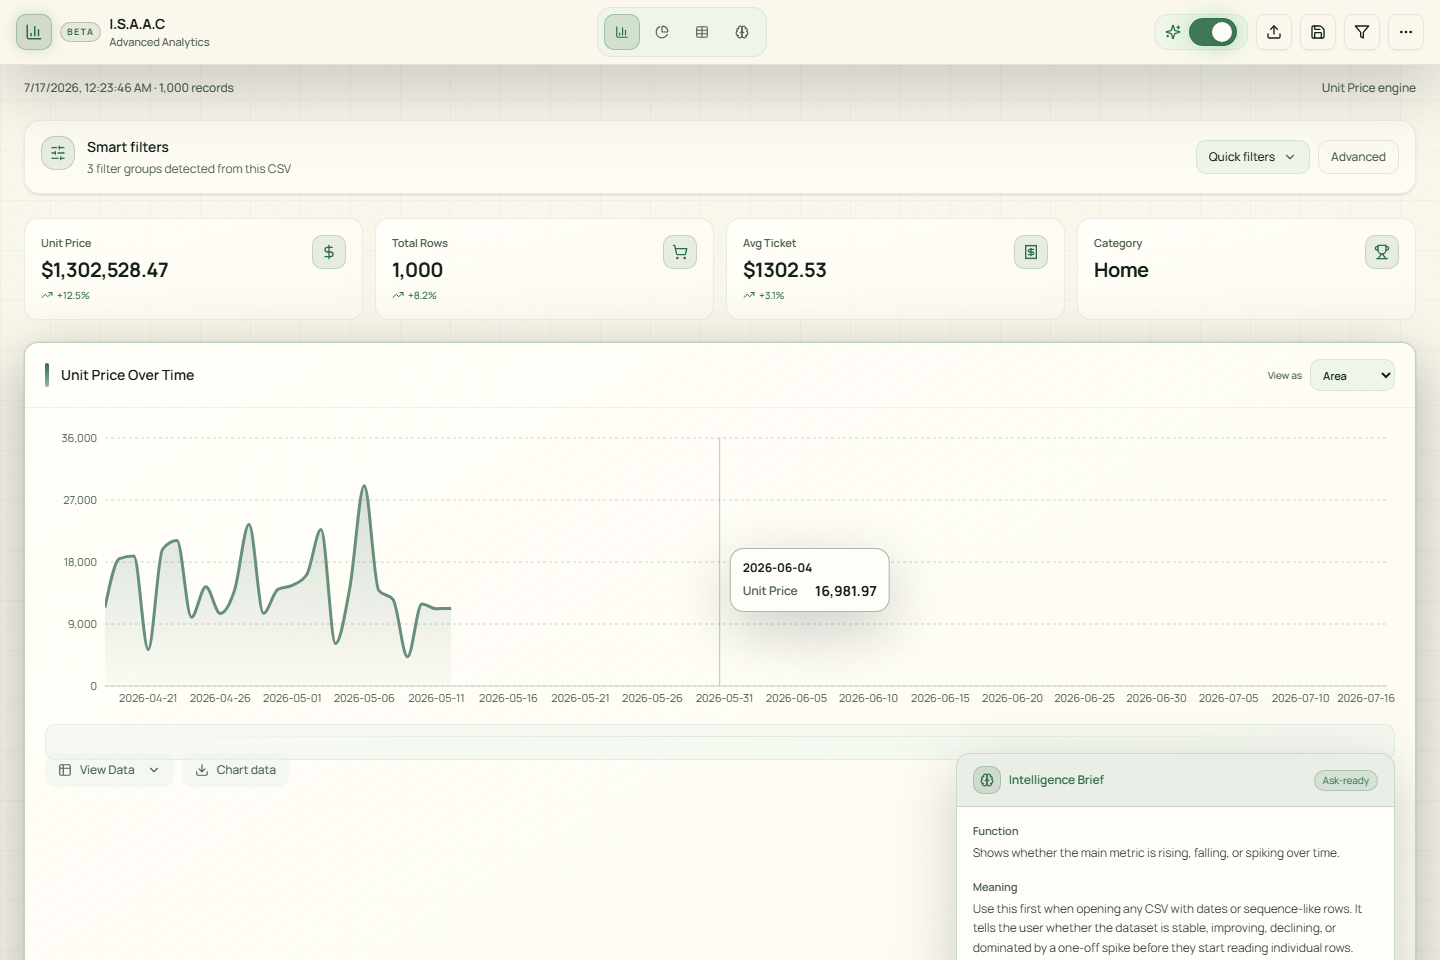
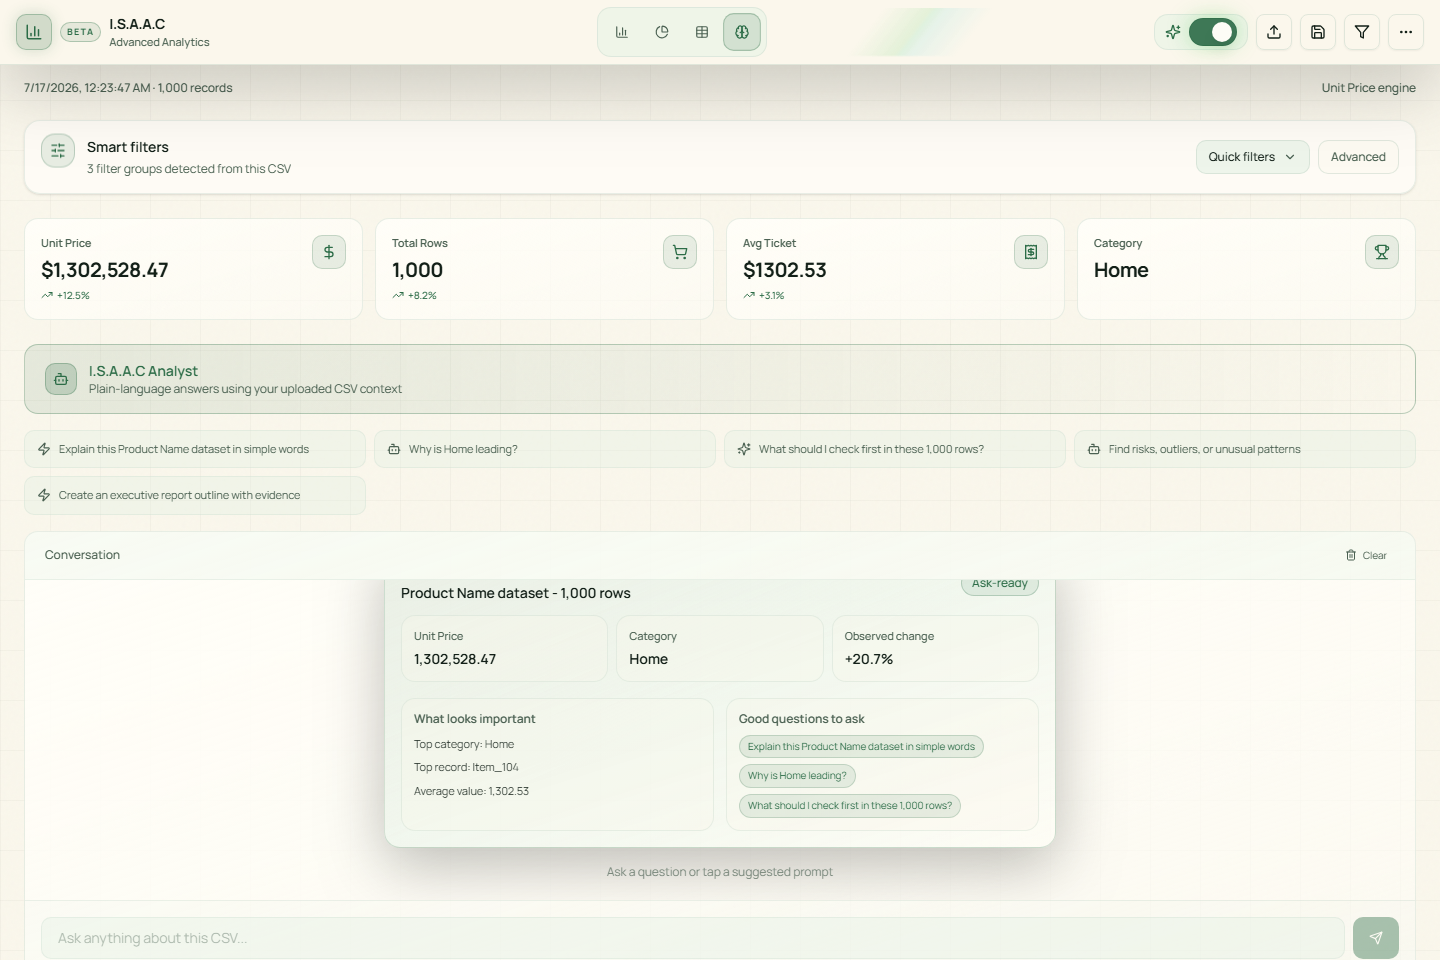
Workflow
01
Drop in the CSV from POS, inventory, finance, CRM, marketplace, logistics, or support tools.
02
See the brief, chart, table, filters, and field quality without building formulas first.
03
Ask why a value spiked, which rows matter, what looks unusual, or what to check next.
04
Edit rows, export the CSV, share the dashboard report, or continue analysis on mobile.
Why it wins
The goal is to reduce confusion. I.S.A.A.C keeps the essential views close: summary, useful filters, chart evidence, spreadsheet rows, AI explanation, and export.
I.S.A.A.C profiles the columns, detects numeric and category fields, and builds a workspace around the file you already have.
The first view highlights the main movement, missing values, duplicates, and the fields worth checking before charts get noisy.
Category-like fields become quick filters, so a retail CSV, finance CSV, and operations CSV each get their own relevant controls.
The assistant uses the uploaded schema, summary, and sampled rows to answer practical questions about what the CSV is showing.
Users stay in read-only mode by default. When they click edit, they can fix values and export the updated file.
The product is being shaped around clean PDF, Excel, and CSV exports that make the dashboard easy to share.
Pricing
Start with beta usage, then upgrade when teams rely on the uploads, AI answers, and exports.
Web checkout supports Visa/Mastercard through Stripe and Malaysian methods through HitPay when the merchant account is activated. Android digital subscriptions use Google Play Billing.
Free
RM0 / month
Try the complete workflow
A useful starting point for exploring CSV dashboards before you commit to a subscription.
Pro
RM29 / month
For regular operators
More room for recurring reports, larger exports, and day-to-day operational questions.
Premium
RM49 / month
For growing teams
Higher limits for analysts, agencies, and teams that rely on CSV analysis more often.
Visa and Mastercard through Stripe, plus Malaysian payment methods through HitPay after merchant approval.
Android subscriptions use Google Play Billing. iPhone and iPad subscriptions use Apple App Store billing.
Paid web subscriptions provide invoice and receipt access. Manage or cancel from the billing portal.
The guest workspace lets visitors upload a CSV, inspect adaptive charts and filters, ask a local question, edit a few cells, and download a preview without signing in. After two guest actions, sign-in is required for saved workspaces, private AI analysis, and larger exports.
Trust and launch readiness
The public website should make buyers comfortable before they upload business data. That means plain privacy language, secure auth, deletion paths, and visible support.
Production runs behind HTTPS/TLS with hardened headers and app isolation.
Dashboard routes require authentication; public routes remain marketing and support.
Browser, Android, and iOS paths are treated as one product family.
Users can edit, export, and delete their data from clear product surfaces.
FAQ
No. The product is now being built as a general CSV intelligence workspace. It adapts to the uploaded columns instead of assuming one fixed template.
Yes. The browser SaaS is the primary PC experience. Android and iOS are companion apps for mobile-first checking and approvals.
Yes. The data grid is read-only by default, then switches into edit mode when the user chooses to make changes.
Charts use tap-to-inspect behavior and a view-data fallback, so users can still reveal exact values without needing a cursor.
I.S.A.A.C Beta